After COVID-19: The long haul back – Part 3
This post was originally published on SCN Australia.
Mobile device data continues as a powerful and insightful tool to measure the changes in shopper visitation patterns, almost in real-time – it’s fascinating stuff. The following charts show how our centres are performing in relation to visitation levels. Part 3 of this series by Tony Dimasi of GapMaps, tracks visitation levels up to 27 June.
At the time of writing, it is now about six weeks since the first steps were taken by NSW in the easing of COVID-19 restrictions and about five weeks since the more significant easing across most other states occurred. Unfortunately, the re-emergence of high levels of infection in Victoria over recent weeks – after the state had recorded a number of days of very few or even zero new infections – is an unwanted bump in the road to recovery for shopping centres in that state.

It is still early days to be making definitive pronouncements about the likely date of return to ‘normal’ for shopping centres or to be able to say with confidence exactly what the new normal will look like. There is, however, an increasingly wide array of information available to help us understand where we are on the path back to recovery and one conclusion that can be drawn with some confidence, I believe, is that much of the ground lost by shopping centres during the lockdown period has already been recovered.
Personal mobility data collected via smartphone usage, often referred to as device data or mobile device data, is one such source of information, providing a powerful and insightful tool to measure the changes in visitation patterns, both negative and positive, almost in real-time. GapMaps’ device data provide a clear picture of what has happened to shopper visitation levels both during the lockdown period and in the various phases of recovery.
For the purpose of comparison pre-COVID-19 ‘normal’ is defined as the pre-Christmas period last year, ie. September 2019, and weekly tracking of visitation levels, for each type of shopping centre, has been undertaken up to Friday, 27 June 2020. The benchmark data presented below reflects the aggregated findings across 100 regional centres, 100 sub-regional centres, 150 neighbourhood centres and nine outlet centres, thereby providing a robust view of what has been happening across each level of the shopping centres’ hierarchy.
Chart 1 shows the longer-term visitation trends for each centre type, commencing in September 2019.
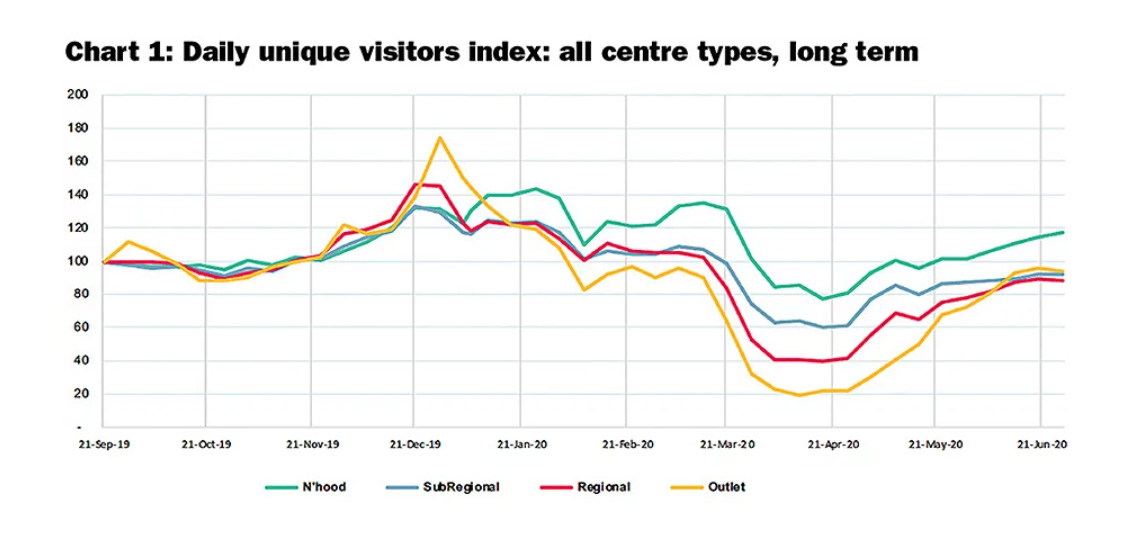
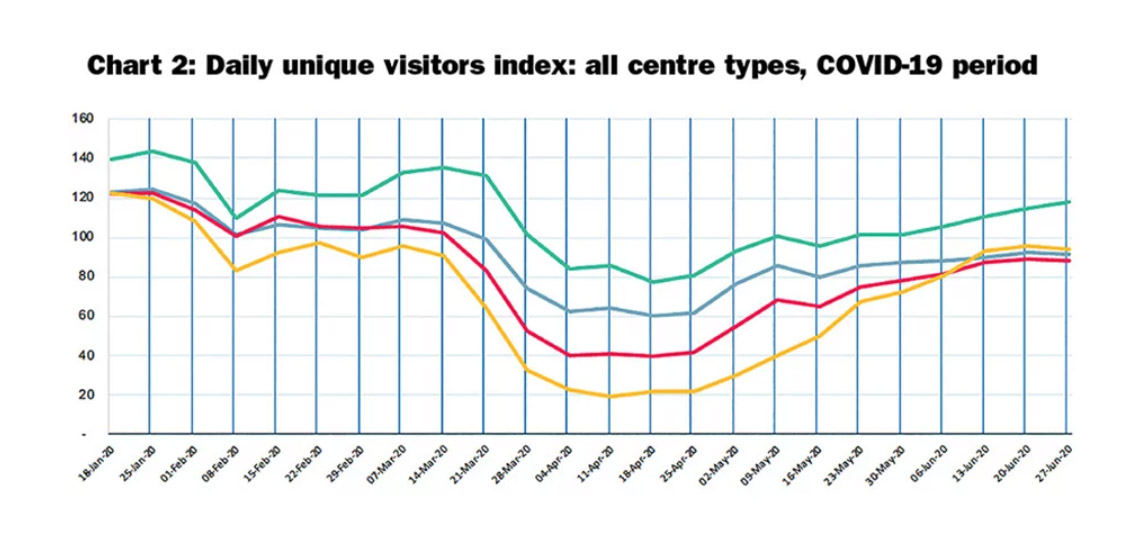
Chart 2 shows in greater detail the COVID-19 impacts, from the week commencing 20 January 2020 (when the first case of the virus was diagnosed in Australia) through to the week commencing 29 June 2020.
Along this timeline, the key inflection points were the period around 13 March 2020 when gatherings of 500 people or more were prohibited; 25 March 2020 when Stage 3 lockdown measures were imposed in all states; the first week of May 2020 when the progressive easing of restrictions commenced; and, for Victoria, the week commencing June 22.
In that week, restrictions in Victoria were once again increased rather than eased, though not back to the same levels as the original lockdown conditions for most of Melbourne and the regional areas. For a small part of Melbourne, though, a hard lockdown was imposed at the end of that week and the confidence of the city’s population suffered a significant setback.
On a national basis, the recovery in visitation levels continues to gain momentum steadily across all centre types though with neighbourhood centres maintaining their status as the centre format least affected. Regional, Sub-regional and Outlet centres are all now back to 90%-95% of their pre-Christmas visitation levels and the strong rebound in visitation to Outlet centres being most evident
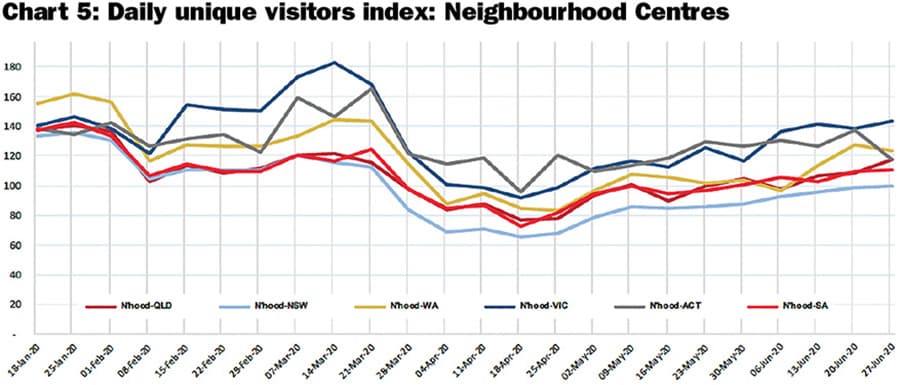
The trends by centre type are presented in Charts 3 to 5, showing the variations on a state-by-state basis for regional centres, sub-regionals and neighbourhood centres respectively.
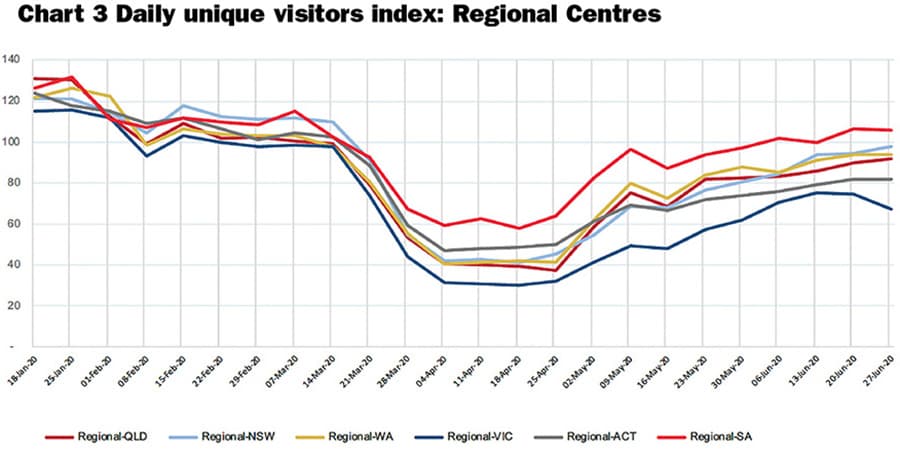
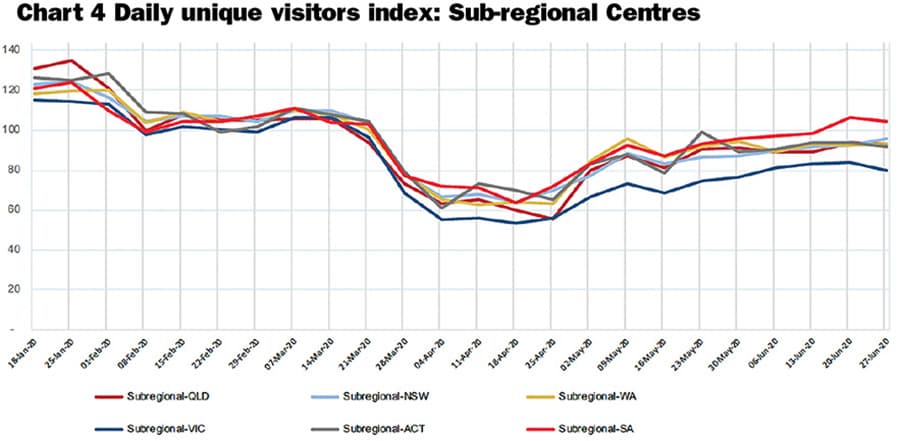
The state-by-state breakdown shows us that for regional centres in South Australia and NSW, visitation levels are back close to pre-Christmas normal, indeed even above that level in South Australia. In Queensland and Western Australia, levels are at 92%-93% of pre-Christmas norms, while in the ACT, greater reluctance to return appears evident with the level at about 80%-85%. Unfortunately for Victoria, where the trajectory was already showing a considerably slower rate of return, the recent surge in infection levels has translated almost immediately into a noticeable further drop-off, now sitting at about two-thirds of pre-Christmas levels.
Expenditure tracking by groups such as Quantium, NAB and CBA similarly suggests that the recovery path for retail expenditure overall is now well established. Quantium is a leader in the field of digital transactions analysis, which is used to deliver insights into customer attraction and spending behaviours for shopping centres. Quantium’s transactions data shows that on a national basis, digital expenditure levels (ie. excluding cash) in all retail categories were higher by mid-June than they were in February, prior to the lockdown period. In some categories, most notably Retail Food & Liquor and Furniture & Hardware, expenditure volumes by mid-June were 20%-30% above February levels, while even in Apparel and Food & Beverage, digital spending had recovered to be above February.
Quantium concludes that the ‘retail wallet’ had benefited from more physical stores being open and customers seeking retail therapy. Quantium’s analysis also shows that after achieving historic online market share highs of up to 80% during the lockdown period (ie. 80% of all digital expenditure was directed to the online channel), market share patterns were steadying at slightly above pre-COVID levels for most categories or still slowly trending downwards. Quantium estimates that, in broad terms, the share of discretionary retailing transacted online increased from about 20% pre-COVID to as high as 33% around mid-April but had dropped back to 25% by early June and is still slowly reducing.
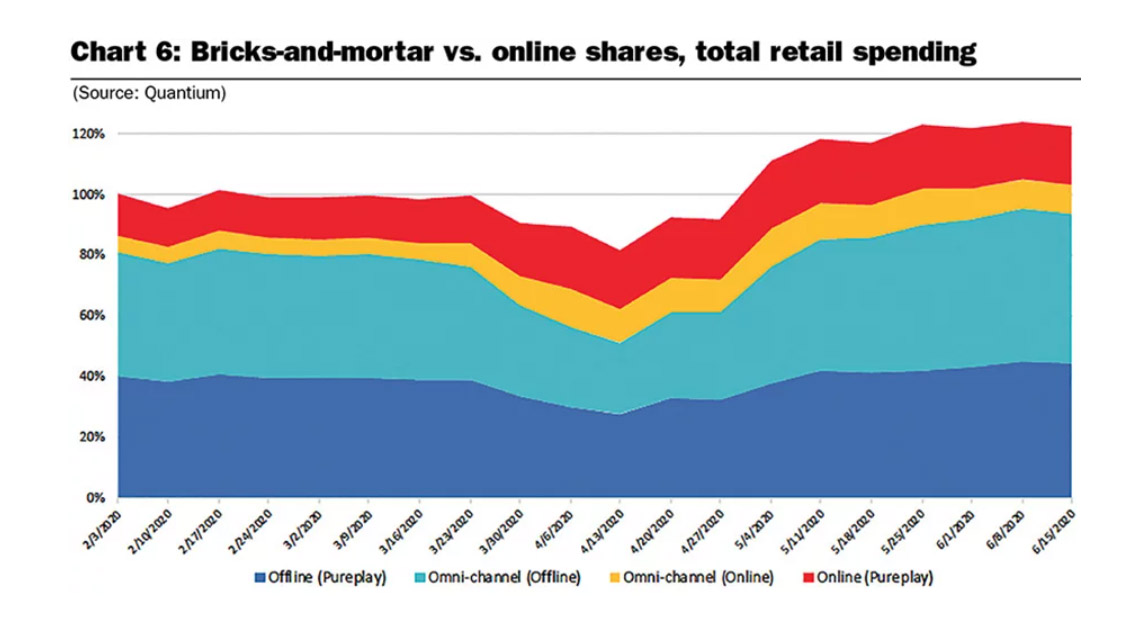
These market share changes have been witnessed against a background of significant growth, during late May and early June, in the size of the total digital discretionary retail pie as measured by Quantium, meaning the volume directed to bricks-and-mortar retailers, either omni-channel or pureplay, was still noticeably higher than it had been in February. The chart 6 highlights these findings.
There is no doubt that we have witnessed a significant acceleration in both consumers’ willingness to engage even more with online retailing – through necessity – and many retailers’ willingness and commitment to utilise the channel, again through necessity. As I have noted in previous assessments for SCN though, there has been some tendency over the past few months to conflate the short-term impacts of the pandemic with some long-term trends that will continue to play out in the retail sector and I remain reluctant to jump to too many conclusions regarding where exactly the dust will settle in, say, six to 12 months’ time.
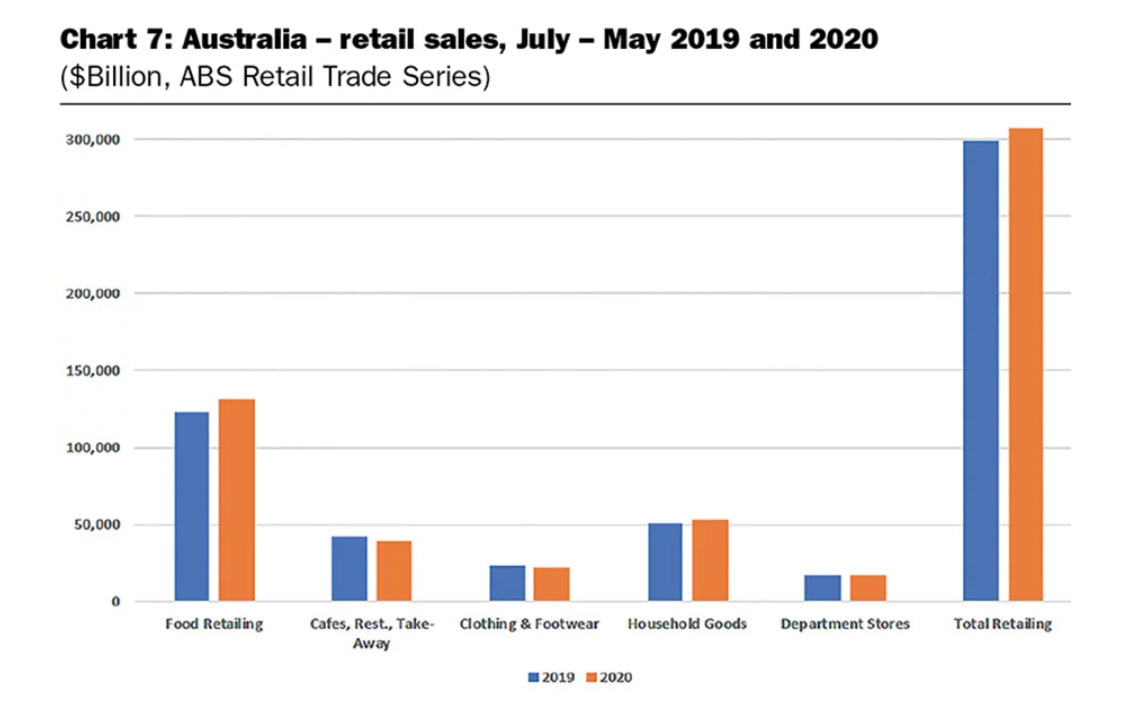
The Australian Bureau of Statistics’ monthly series Retail Trade, which tracks the sales volumes of the retail industry on a store category basis, also points to significant recovery even as early as May. For example, for the comparable 11-month period July to May 2020 period versus 2019, total national retail turnover was actually 2.7% higher, at $306.9 billion versus $298.8 billlion. While there have been some winners and losers across categories, as chart 7 shows, that normally happens every year. Interestingly, the much-maligned Department Stores category has reported stable sales, despite all the impacts of the pandemic, for the 11-month period.
Of course, one unpalatable possibility, given the recent upsurge in the rate of new infections recorded in Victoria, is the spectre of moving back to more restrictive lockdowns, as has already occurred in Victoria. If so, the recovery path could be thrown into further disarray, especially if consumer confidence is impacted if efforts to curb the virus are seen to be failing. Clearly, all Australian governments, national and state, are resisting any push to move back to a national lockdown and are planning to use selective ‘hotspot’ lockdowns as the future strategy.


